 ITLYN
ITLYNThe Paid Social KPI Dictionaryevery creative strategist should know
These are the 25 KPIs I think every creative strategist should know. Not just what they mean, but what they tell me about the customer, where the ad is breaking down, and what I should look at next.

- Words
- Kaitlyn Winey
- Filed
- Measurement, strategy
- Entries
- 25
- Published
- August 2026
If you work in paid social long enough, you will eventually find yourself staring at a dashboard full of numbers that seem to be telling you completely different stories. CTR is down. CPM is up. CPC looks terrible. ROAS is falling. Someone says the creative is fatigued. Someone else says the audience is saturated. Then, inevitably, someone says, “We just need more ads.”
Maybe. But maybe you have no idea what is wrong yet.
That is the thing about paid social: the numbers are not the answer. They are clues.
And if you're a creative strategist, knowing how to read those clues is one of the most valuable skills you can have. You don't need to become a media buyer. You don't need to memorize every metric in Ads Manager. But you should be able to look at performance data and understand what the customer is doing.
Is the creative failing to get attention? Is the message failing to create interest? Are people clicking but not buying? Is the offer the problem? Is the landing page killing conversion? Is the audience too expensive? Or is the creative actually working and the business simply can't afford the cost of acquiring the customer?
The numbers can tell you. You just have to know what they're trying to say.
Think of the customer journey like a series of doors. The first door is getting someone to notice you. The next is getting them interested. Then you need them to keep watching, click, investigate, consider, buy and, ideally, come back. Every KPI gives you a little piece of information about one of those doors.
Here are the KPIs I wish someone had explained to me this way when I started: what they mean, why they matter, and how to use them to figure out what’s actually happening with your creative.
ROAS
Return on Ad Spend
How much revenue your ad generated for every dollar you spent.
calculatedRevenue ÷ Ad spend
Imagine you own a DTC skincare brand. You run an Instagram ad for your moisturizer and spend $100 on the ad. The ad brings 10 people to your website who each buy the $50 moisturizer. You spent $100 on advertising. You made $500 in sales.

That’s 5x ROAS.
In other words, for every $1 you spent on advertising, you generated $5 in revenue. That’s ROAS. But here’s the part people miss: $500 in sales doesn’t mean you made $500 in profit. You still have to account for the cost of the product, packaging, shipping, payment processing and everything else that goes into running the business. ROAS tells you how much revenue your ad generated. It does not tell you how much profit you made. For a creative strategist, this matters because your job isn’t just to make an ad people like. You need to make creative that helps the business acquire customers at a cost that makes sense. You could make an ad with an incredible hook, a 4% CTR and a million views. If it isn’t bringing in profitable customers, who cares? And sometimes the opposite is true. An ad might not be flashy. It might not get a ton of likes. It might never win a creative award. But if it consistently brings in valuable customers at a cost the business can support? That’s a damn good ad.
ROAS = how much revenue came back for every $1 spent on your ad.
The number tells you what happened. Your job is to figure out why.
CAC
Customer Acquisition Cost
What it costs to turn one new person into a customer.
calculatedTotal acquisition cost ÷ New customers
Let’s say your skincare brand from the ROAS example is still thriving (good for you). You spent $1,000 getting new customers last week, and 20 people bought from you for the first time. Your CAC is $50.
Think of CAC like the cover charge for getting someone into the club. You don’t just want to know how much it cost to get them through the door. You want to know what happens once they’re inside.

That means it cost you $50 to turn one stranger into a customer.
And this is where CAC gets interesting. If that customer spends $35 and never comes back, $50 CAC is a problem. If that customer spends $100 today and keeps buying from you for the next three years, $50 CAC could be a great deal.
That’s why CAC is bigger than a creative metric. A great ad can get someone to stop scrolling, click, and even buy. But if you’re spending too much to get that person through the door, the business has a problem. And this is also why CAC and CPA (don’t worry we will cover this in just a bit, just humor me for now) aren’t the same thing. CPA usually tells you what it cost to get a specific action, like a purchase or lead. CAC asks a bigger question: How much did it actually cost us to acquire a new, paying customer? For a creative strategist, that’s the number that connects your work to the economics of the business.
CAC = the total cost of acquiring a new, paying customer.
The strategist question“What did it cost us to get this customer, and are they worth more than that?”
Conversion Rate
The percentage of users who complete a specific desired action (usually a purchase).
calculatedConversions ÷ Visitors × 100
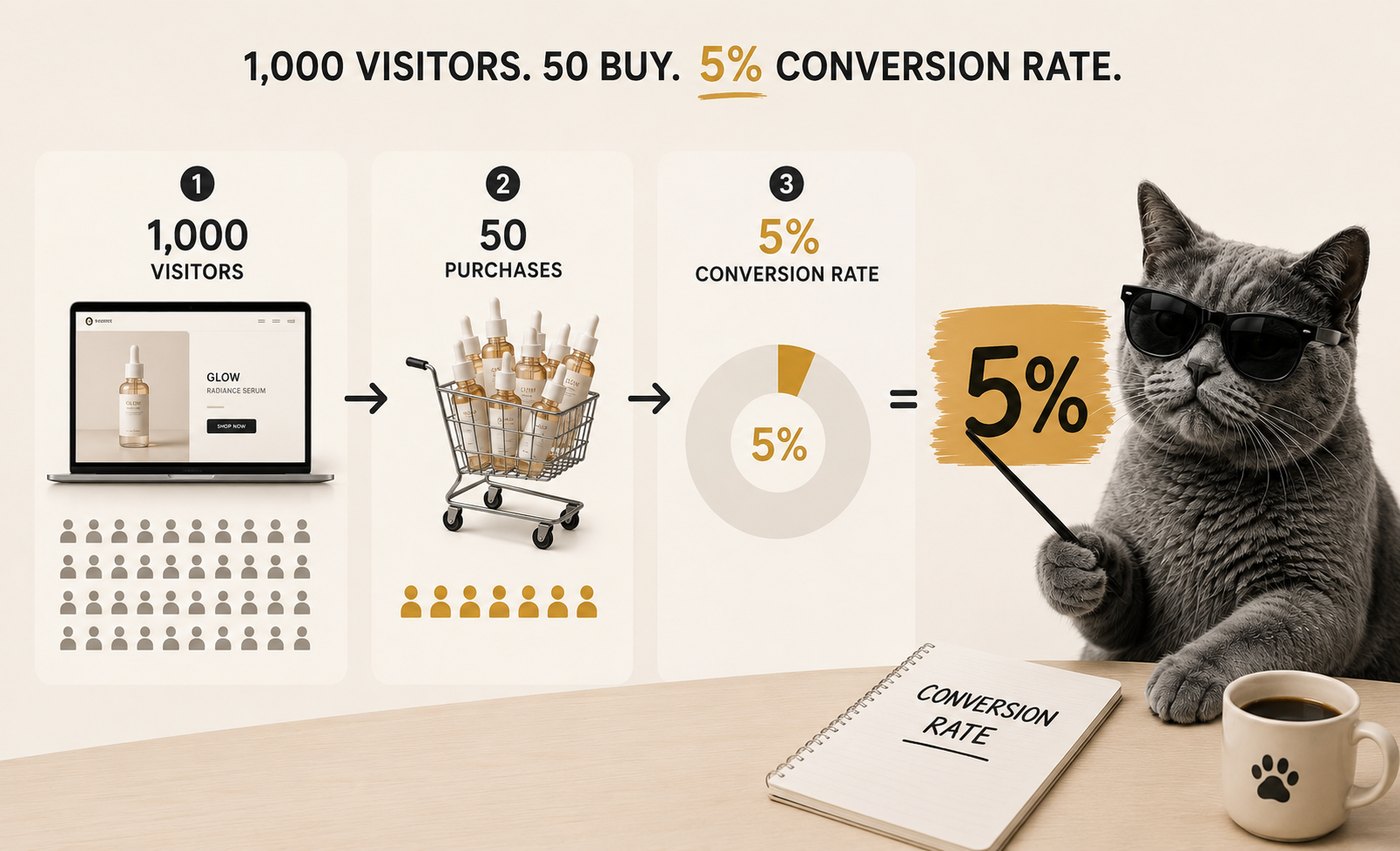
Let’s say 1,000 people visit your website. 50 buy. Your conversion rate is 5%.
Think of it like a store. Your ad gets someone to walk through the front door. They look around, pick something up, maybe even put it in their basket. But do they actually take it to the register?
That’s it.
Conversion rate tells you what happens after the click.
That’s conversion rate. And this is where it gets really useful for a creative strategist. Let’s say your ad has a terrible CTR, but the people who do click are buying like crazy. Your website probably isn’t the problem. Your ad might be. Now flip it. Your ad has a fantastic CTR. People are flooding onto the site. But almost nobody is buying. The ad did its job. Something after the click isn’t working. Maybe the product page is confusing. Maybe the offer isn’t compelling. Maybe the price is a shock. Maybe checkout is a nightmare.
The point is: don’t blame the ad for a problem that happens after the ad.
Conversion rate helps you figure out where the customer journey is breaking.
Conversion Rate = the percentage of visitors who take the action you want.
The strategist question“We got them interested. Why didn’t they buy?”
CTR
Click-Through Rate
The percentage of people who clicked your ad, such as clicking the image, video, headline, or call-to-action button.
calculatedClicks ÷ Impressions × 100
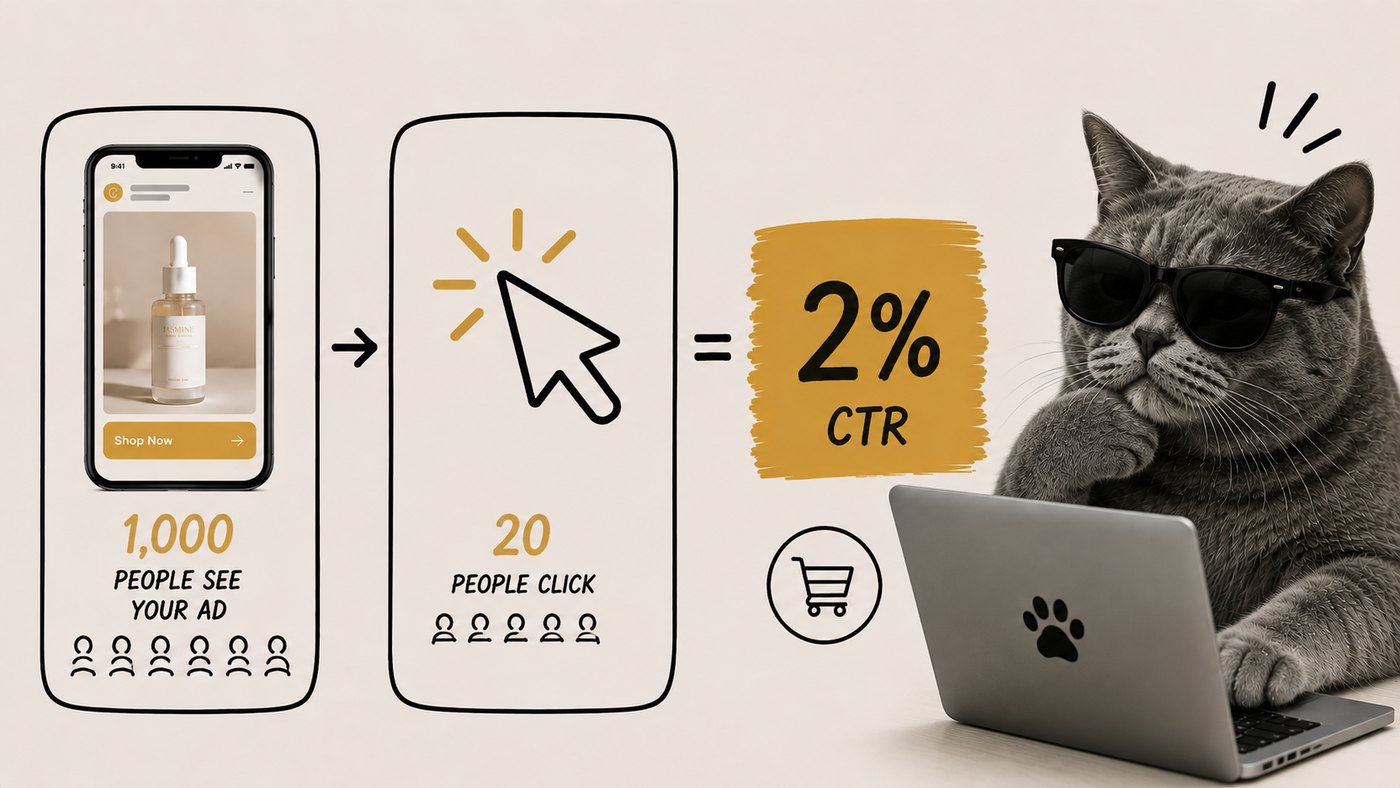
Let’s say 1,000 people see your ad. 20 click. Your CTR is 2%.
Think of CTR like a store window. Your hook gets someone to look. Your message gives them a reason to walk inside. You can have the most beautiful window on the block. People might stop and stare. But if nobody walks through the door, something isn’t giving them a reason to come in.
Simple.
But what I really care about with CTR is what happened between the scroll and the click. Someone saw your ad. They stopped. Then they had to make a tiny decision: “Do I want to know more?” If they click, the answer was yes.
That’s why CTR is so useful for creative strategy. If your hook is strong but CTR is weak, you may have successfully grabbed attention without creating enough interest. They’re looking. They’re just not sold on what happens next. That points you toward the message, offer, CTA or overall idea, not necessarily the hook.
CTR = the percentage of people who saw your ad and clicked.
The strategist question“We got them to look. What made them want to know more?”
Attention comes first.Thumbstop → Hook → Hold
Hook Rate
The percentage of people who watched the first few seconds of your video.
calculated3-second views ÷ Video plays × 100
Let’s say 1,000 people start watching your video and 300 make it past the first three seconds. Your Hook Rate is 30%.
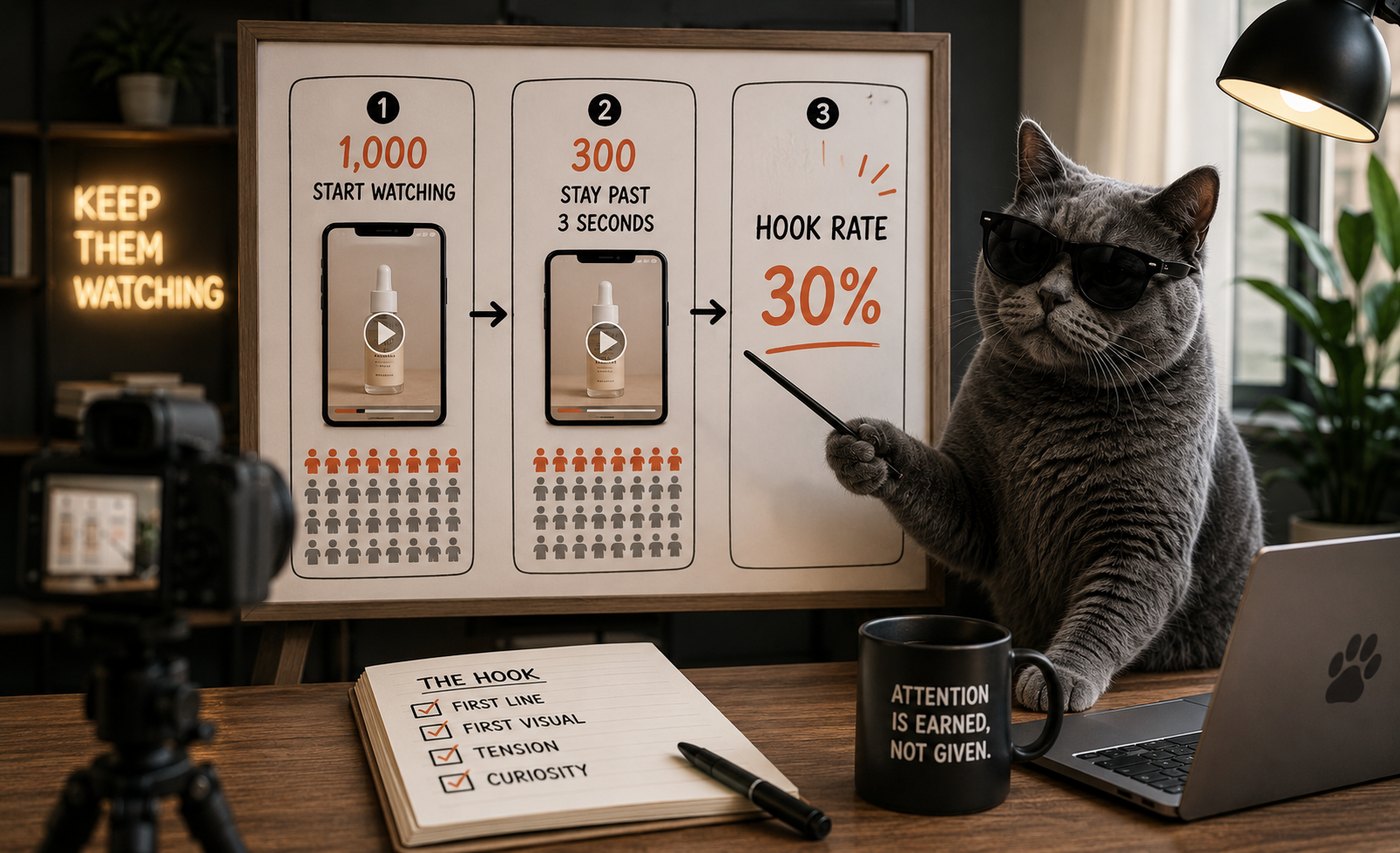
But the number itself isn’t really the interesting part. What I want to know is what happened in those first three seconds. Someone sees your ad. They hear the first line. They see the first frame. Then they make a decision: Do I keep watching, or do I keep scrolling? That is the job of the hook.
Think about the first sentence of a conversation. You walk up to someone and say, “I went to a yoga class on Saturday.” Fine. But there’s not much pulling you in. Now imagine someone says, “My husband left me for the coworker he told me not to worry about.” Chances are, you’re going to look up… and if you’re like me, you’re going to NEED to know what comes after (you know you love the drama too).
- Why?
- What happened?
- What changed?
That’s a much stronger reason to keep listening. And notice that the product isn’t even mentioned yet. That’s okay. The hook isn’t supposed to explain everything. It’s supposed to create enough curiosity to earn the next few seconds. This is why Hook Rate matters so much to creative strategists. If people are leaving in the opening, it doesn’t matter how good the testimonial is at 12 seconds or how compelling the CTA is at 24 seconds.
They never got there.
So when Hook Rate is weak, don’t immediately rewrite the entire ad. Start at the beginning. Look at the first line, the first visual, the tension, the question and the reason someone would want to keep watching.
Hook Rate tells you how well your opening stops people from scrolling.
The strategist question“Did the first few seconds give them a reason to stay?”
Thumbstop Rate
The percentage of people who stopped scrolling long enough to pay attention to your ad.
calculated3-second views ÷ Impressions × 100
1,000 people see your ad. 300 stop. Your Thumbstop Rate is 30%.
Now imagine two versions of the same moisturizer ad.
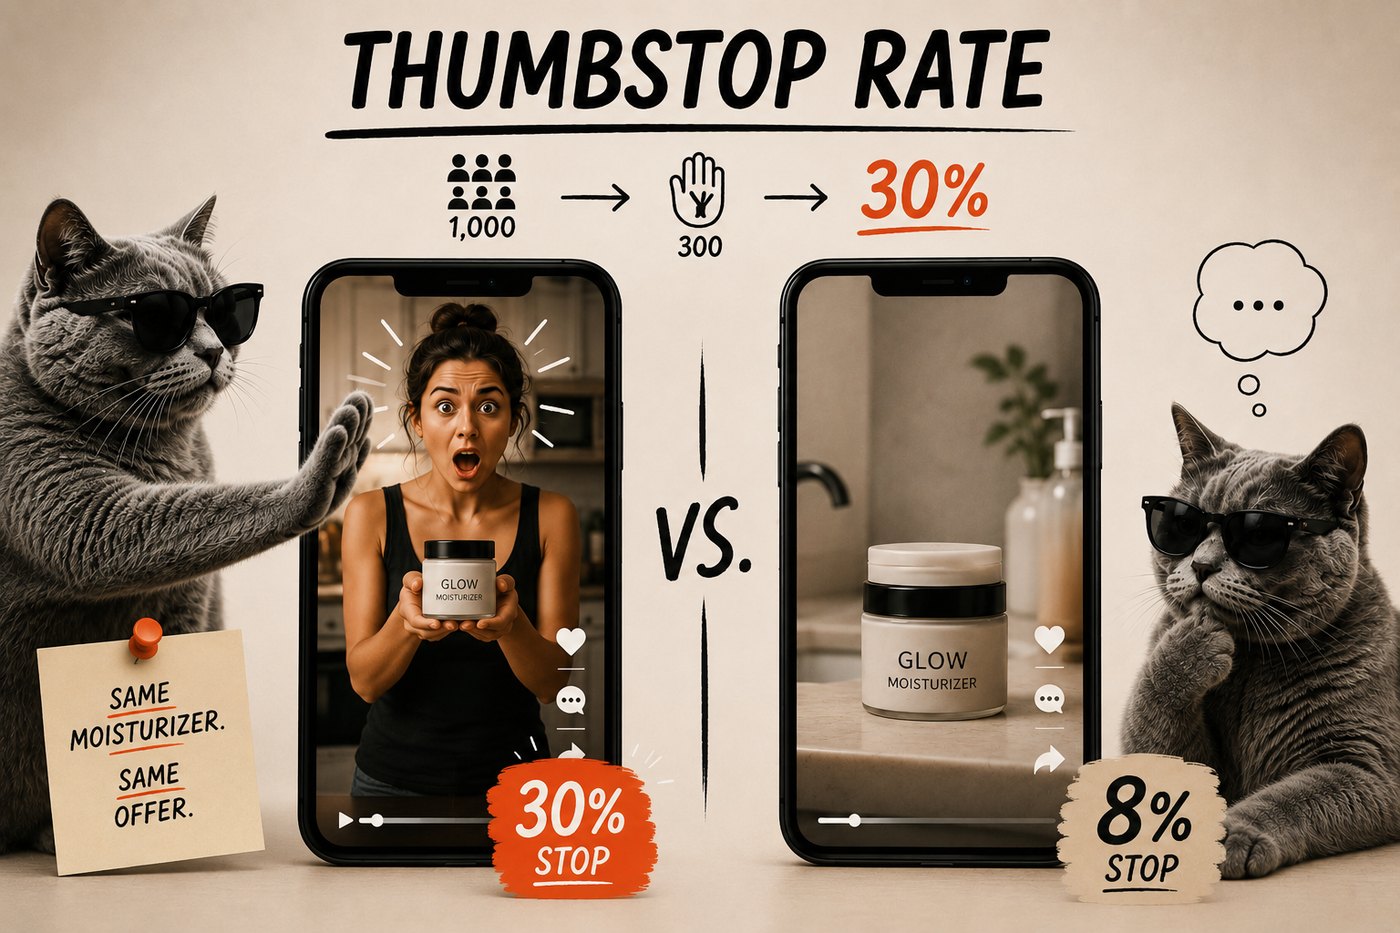
Same product. Same offer. Completely different ability to interrupt the scroll. That’s why I look at Thumbstop Rate before I start diagnosing the rest of the ad. If only 8% are stopping, I don’t care how good the CTA is. 92% of ad watchers never got far enough to see it.
Thumbstop Rate = the percentage of people who stopped scrolling.
The strategist question“What made them stop?”
Hold Rate
The percentage of viewers who are still watching your video at a specific point, showing how well your content holds their attention.
calculatedViews at that point ÷ Video plays × 100
1,000 people start your video. 700 are still watching at 3 seconds. By 10 seconds, only 350 remain.
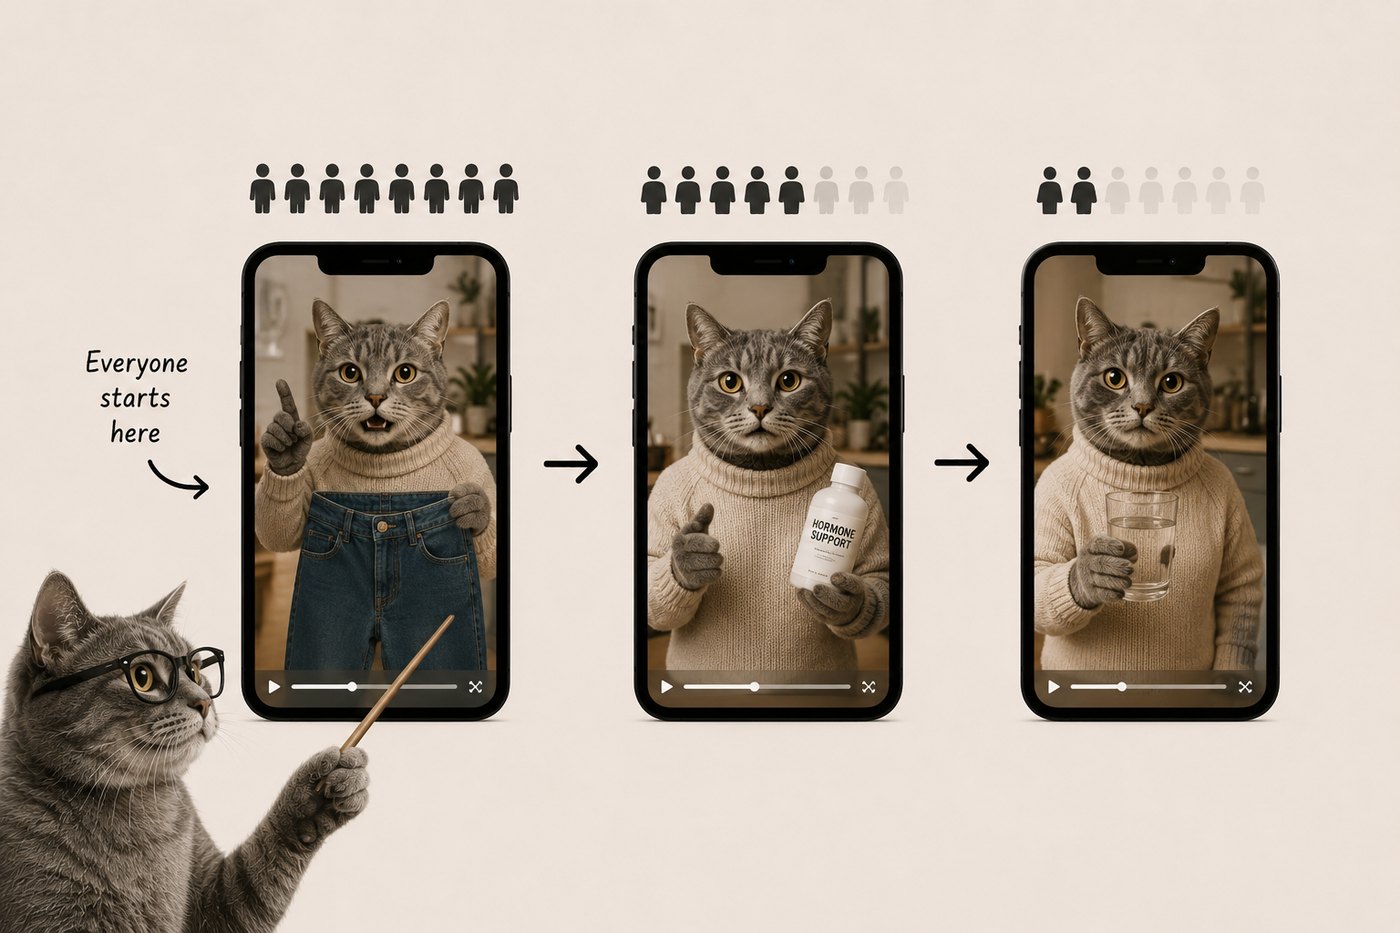
Your opening worked. The body lost them.
That’s the difference between a hook problem and a content problem. Maybe the pacing slowed down. Maybe the story became predictable. Maybe you spent too long explaining the product. This is why I don’t just look at whether an ad has a good hook. I want to know what happened after the hook.
Hold Rate = the percentage of viewers who keep watching.
The strategist question“Where did we lose them?”
CPA
Cost Per Acquisition
CPA tells me how much it cost to get someone to do the thing I wanted them to do. For ecommerce, that usually means buying.
calculatedAd spend ÷ Actions
You spend $1,000 and get 20 purchases. Your CPA is $50.
Think about it like this: you run a pop-up shop and spend $1,000 getting people through the door. Twenty people buy something. You paid $50 to get each customer.
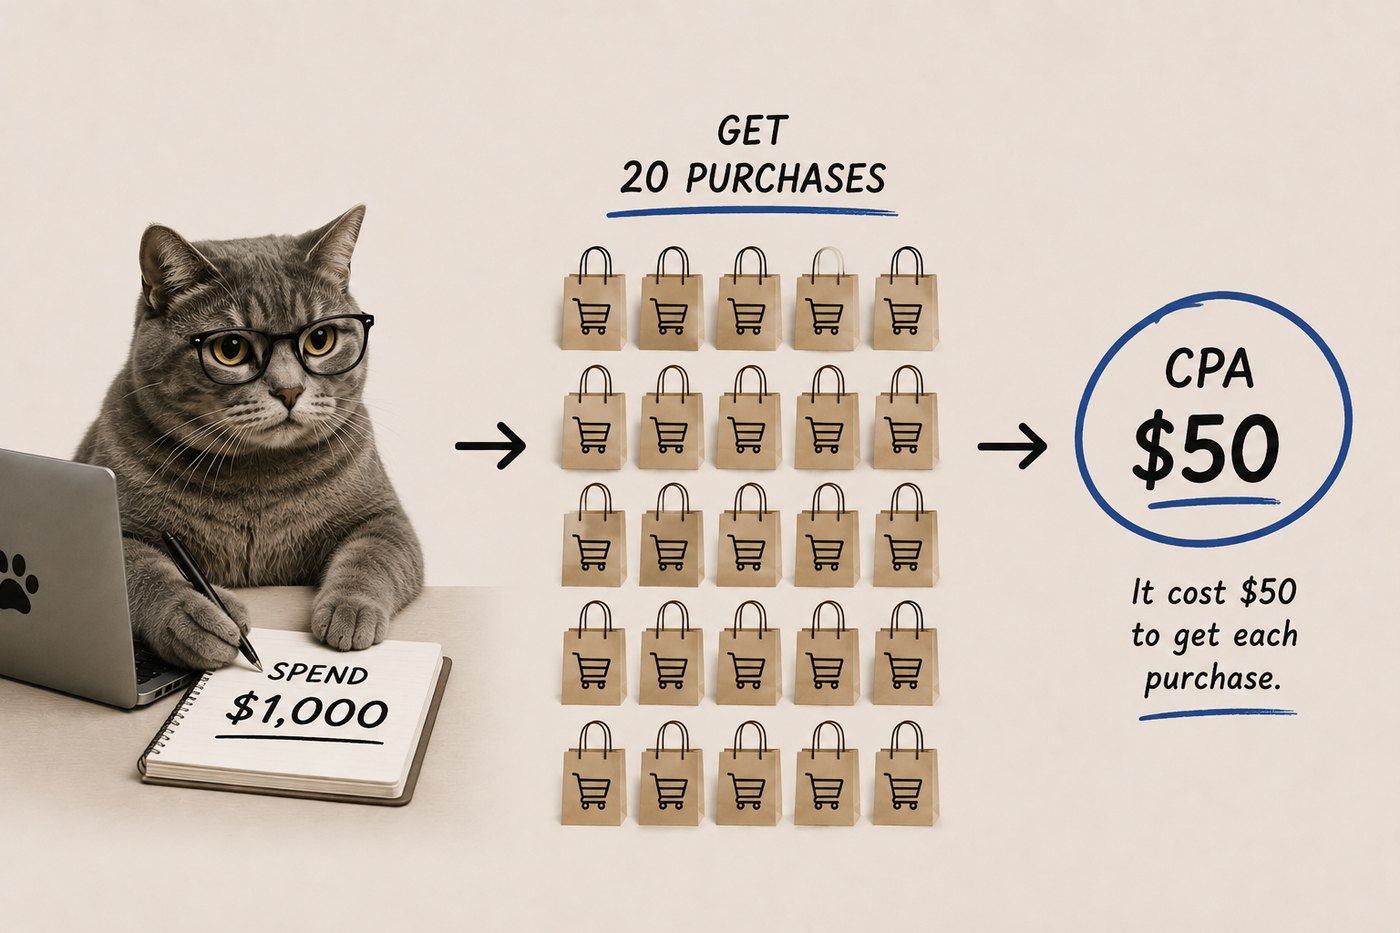
Now imagine two ads selling the same moisturizer.
Ad B is clearly more efficient. But the interesting question isn’t which one won.
It’s why.
Maybe Ad B spoke to a more relevant problem. Maybe the hook was stronger. Maybe the offer was clearer. CPA tells me what happened. Creative strategy helps me figure out why.
CPA = what it cost to get a specific action.
CAC = what it cost to acquire a new customer.
The difference: CPA can measure the cost of any conversion, like a lead, signup, download, or purchase. CAC specifically looks at the cost of turning someone into a paying customer.
The strategist question“What is this creative doing that makes the result cheaper?”
LTV
Lifetime Value
The total amount of money a customer is expected to spend with your brand over time.
calculatedAverage order value × Orders per year × Years retained
LTV looks at the total value a customer generates over their relationship with a brand. Imagine two people buy the same $50 moisturizer.
Customer A buys it once. LTV: $50. Customer B loves it and orders it every month for two years. Potential LTV: $1,200.
Think about a coffee shop. Someone who buys one $5 latte is nice. Someone who comes in every morning for five years is a very different customer.
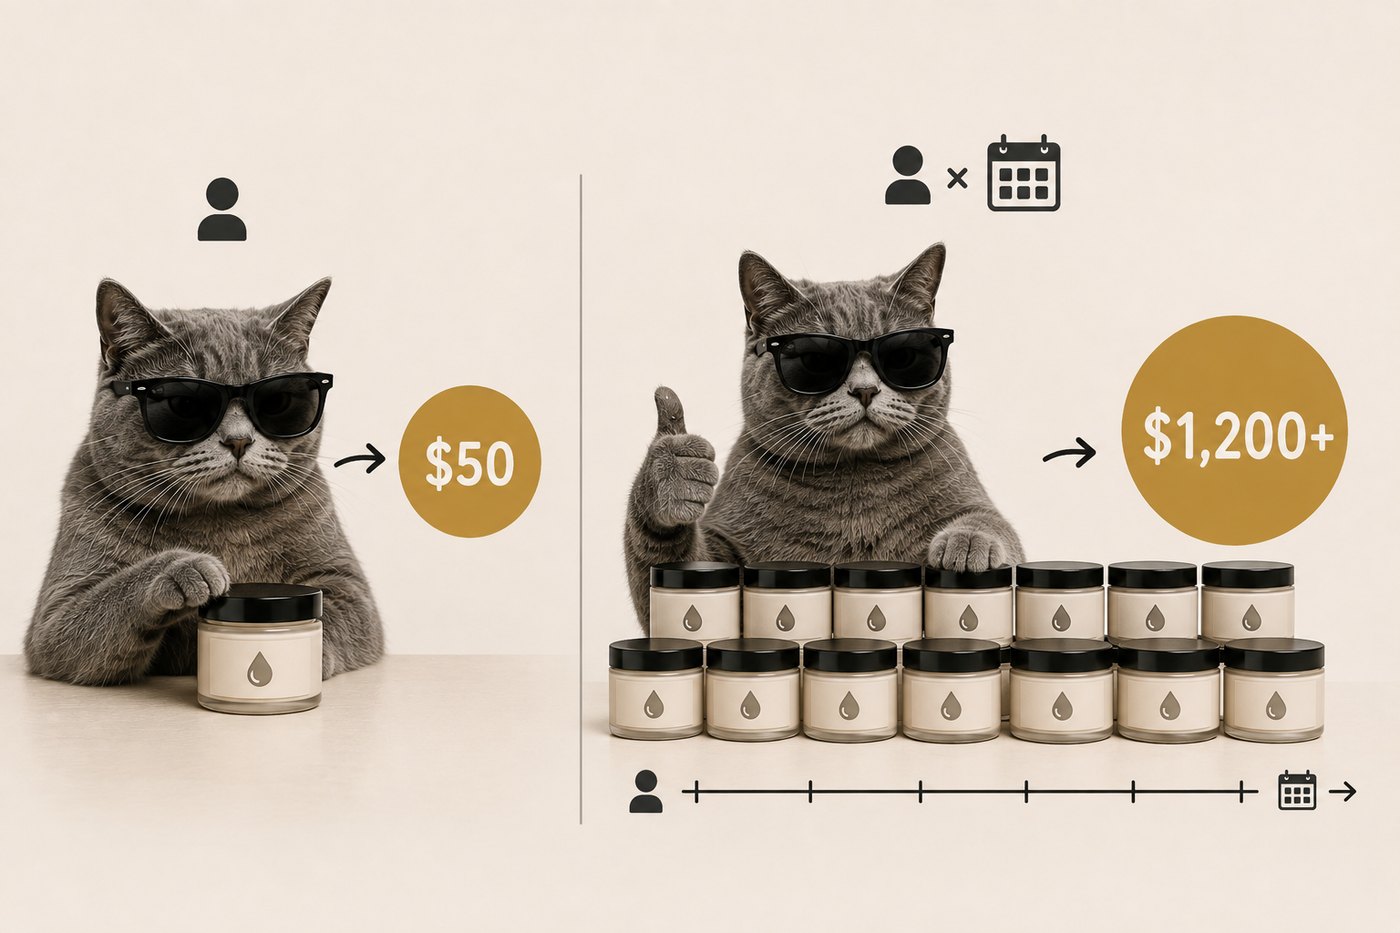
Same first purchase. Completely different customer.
That’s why LTV matters. If I know customers tend to come back again and again, the business may be able to spend more to acquire them in the first place.
LTV = what the customer is worth over time.
The strategist question“Are we acquiring a one-time buyer or a customer who keeps coming back?”
AOV
Average Order Value
The average amount someone spends in a single order.
calculatedRevenue ÷ Orders
AOV is the average amount spent in a single order. If 100 customers spend $10,000, your AOV is $100.
Think about two people walking into the same store. One buys a $30 candle. The other buys the candle, a room spray and a gift set. Same store. Very different basket.
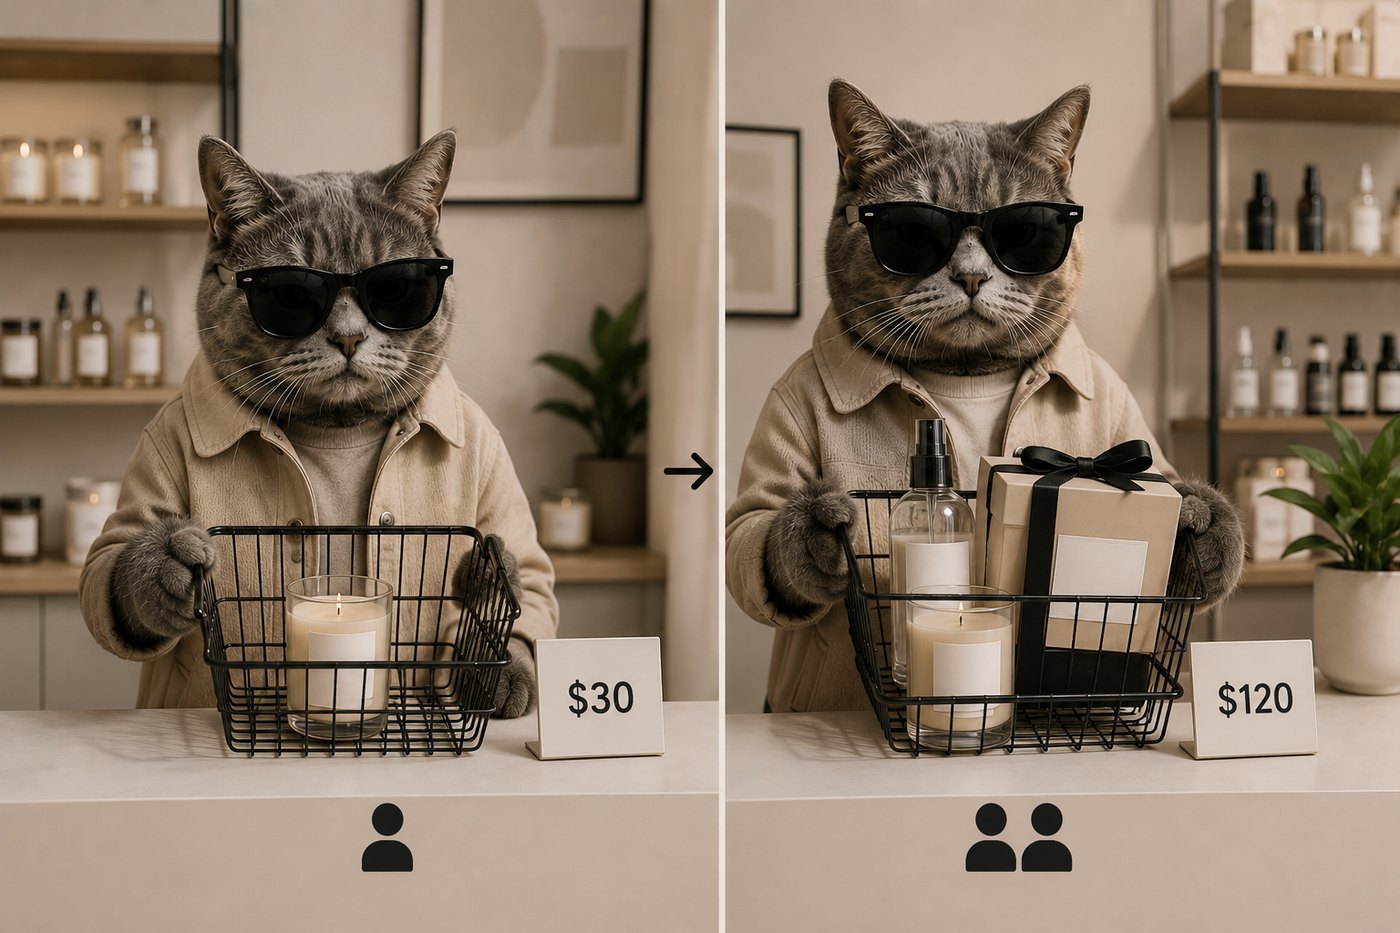
That’s AOV. And for a creative strategist, that can create opportunities. Maybe the goal isn’t just getting more people to buy. Maybe the creative can encourage bundles, multiples or complementary products.
AOV = the average size of the shopping cart.
The strategist question“How much does the average customer spend when they buy?”
Add-to-Cart Rate
Add-to-Cart Rate tells me how many visitors went from looking to actually putting the product in their cart.
calculatedAdd-to-carts ÷ Visitors × 100
Imagine 1,000 people visit your moisturizer page. 50 add it to their cart. That’s a 5% Add-to-Cart Rate.
Think about walking into a store. You look around. Then you find a sweater you like enough to take into the fitting room. You’re not at the register yet. But you’ve moved from “just looking” to “I might actually buy this.”

That’s what an add-to-cart tells me. If people are clicking but nobody is adding the product to their cart, something isn’t closing the gap between interest and intent.
Add-to-Cart = “I might buy this.”
The strategist question“What made them interested, but not interested enough to buy?”
Outbound CTR
The percentage of people who clicked your ad and went to a page outside the platform, like your website or landing page.
calculatedOutbound clicks ÷ Impressions × 100
Outbound CTR measures the people who clicked through to the destination you’re sending them to. Imagine you’re scrolling Instagram and see a pair of sneakers. You tap the ad. That’s the important behavior here: you actually wanted to go somewhere. It’s different from simply interacting with an ad.
Think about a store. Someone can stop outside and look through the window. Outbound CTR is closer to actually opening the door.
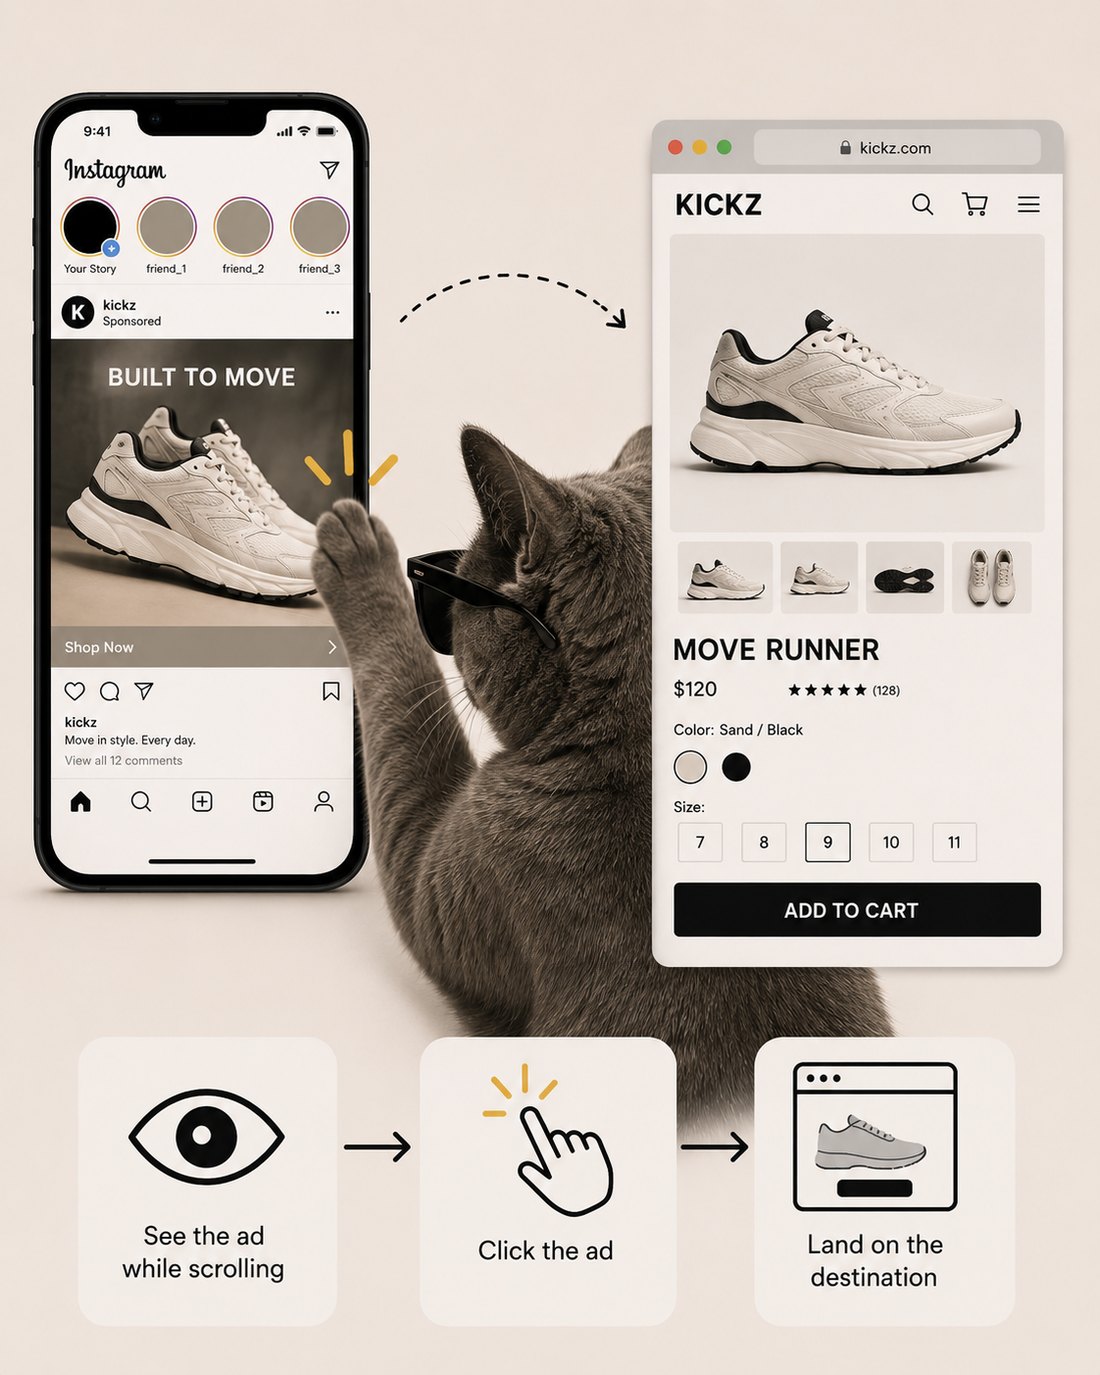
That’s useful because it tells me whether the creative created enough interest to make someone leave the feed and investigate further.
Outbound CTR = “I want to see what’s on the other side of this.”
The strategist question“Did we give them enough reason to leave the feed?”
Landing Page Views
How many times your website or landing page loaded after someone clicked your ad.
calculatedCompare against clicks: Landing page views ÷ Link clicks × 100
Imagine someone clicks your ad for a pair of sneakers. They click. Then the website takes forever to load. They close Instagram.
Think of it like someone saying, “I’m coming to your store,” versus actually walking through the door.
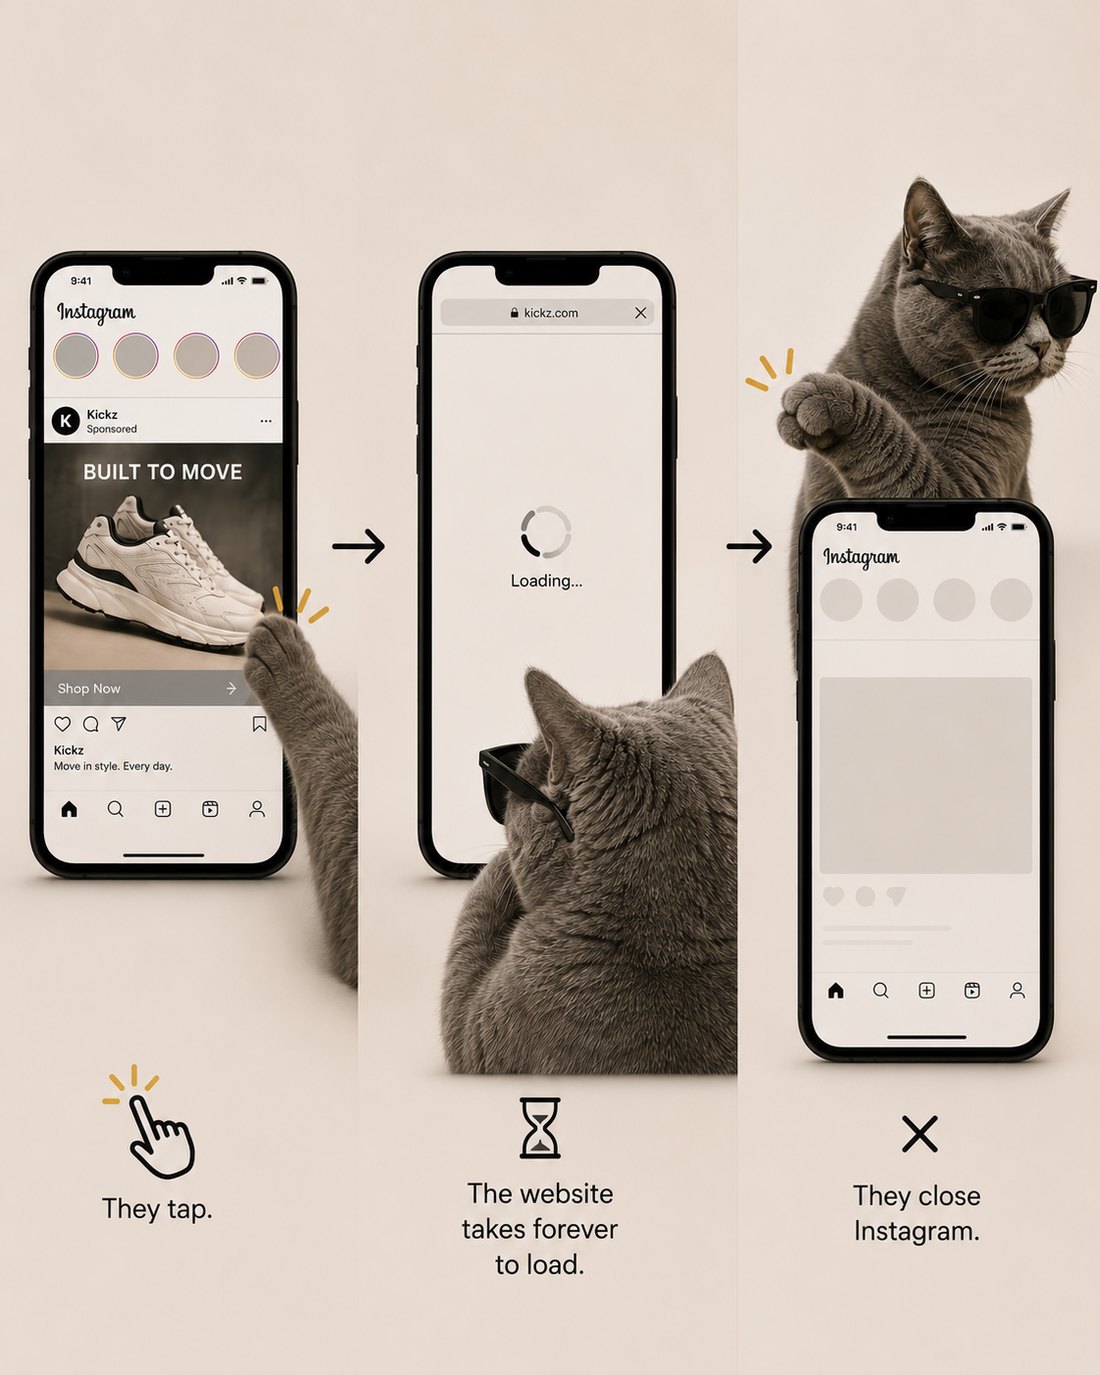
You got the click. You didn’t get the visit.
That’s the difference.
If clicks are high but Landing Page Views are much lower, I want to know what’s happening between those two moments.
Click = “I’m going.” Landing Page View = “I’m here.”
The strategist question“Are people actually reaching the experience we’re sending them to?”
Cost Per Add to Cart
What it costs to get one person to add the product to their cart.
calculatedAd spend ÷ Add-to-carts
Say you spend $500 and get 100 add-to-carts. Your Cost Per Add to Cart is $5.
Think about a clothing store. You don’t just want people walking past the window. You want them to pick something up and take it to the fitting room.

That’s what this metric helps you see. You might be getting cheap clicks, but very few people are adding to cart. That tells me the ad is getting people to your site, but something on the site isn’t convincing them to keep going.
Cost Per Add to Cart = what it costs to get someone seriously considering the purchase.
The strategist question“Are we generating cheap clicks or real buying intent?”
Cost Per Purchase
How much you spend to get one purchase.
calculatedAd spend ÷ Purchases
This one is brutally simple.
You spend $1,000. You get 20 purchases. Your Cost Per Purchase is $50.
Imagine a lemonade stand. You spent $100 getting people to come by. Twenty people actually bought lemonade. Each customer cost you $5 to acquire.
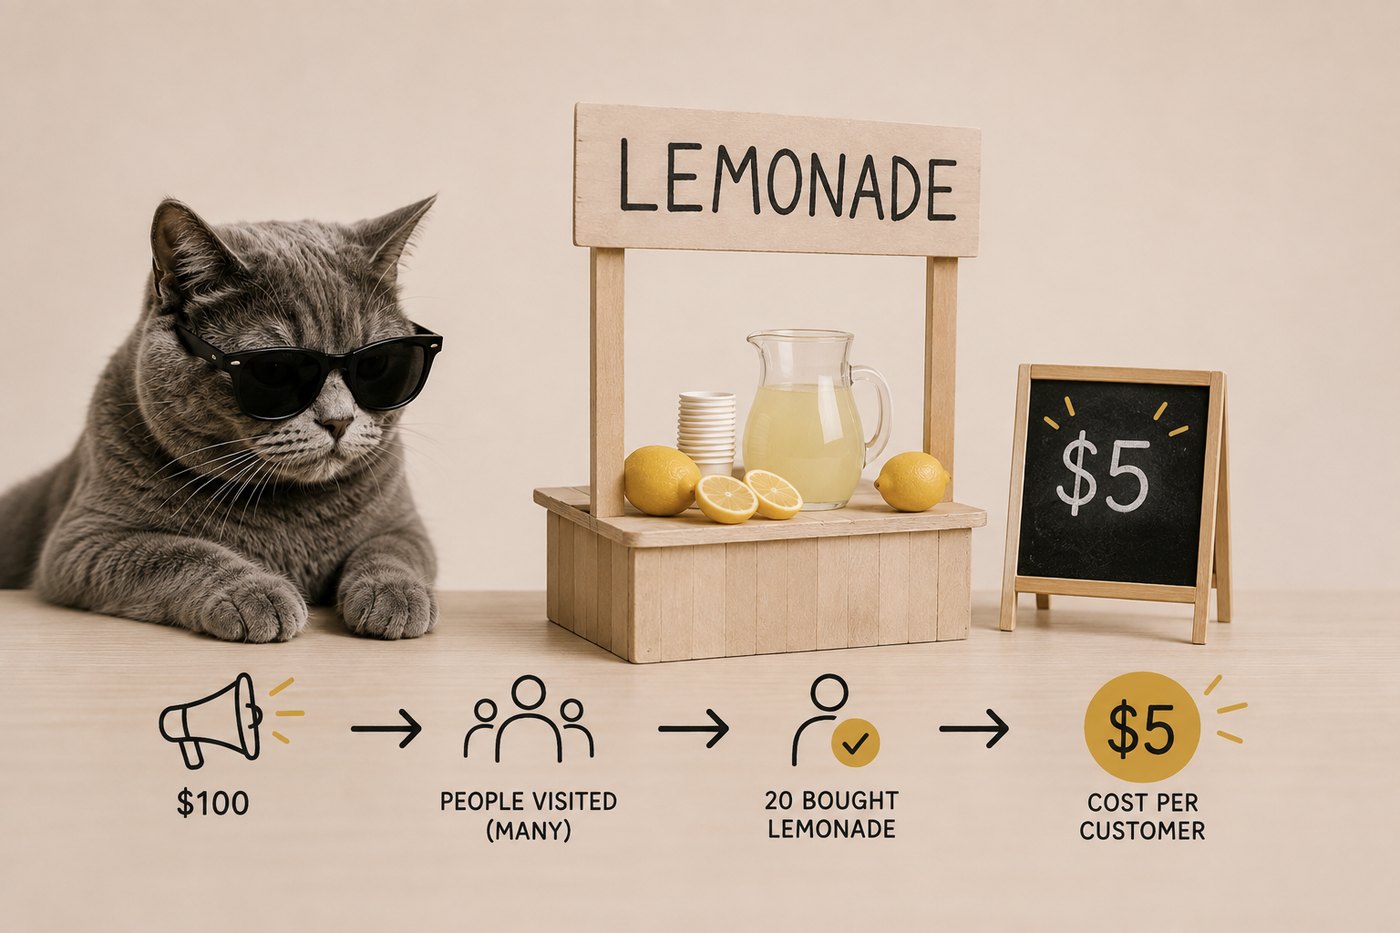
That’s the number you’re looking at. It can be especially useful when comparing creative because now you’re comparing ads based on customers, not clicks.
Cost Per Purchase = what it cost to make the sale happen.
The strategist question“Which creative is actually bringing us customers most efficiently?”
CPC
Cost Per Click
How much you pay, on average, each time someone clicks your ad.
calculatedAd spend ÷ Clicks
Spend $100 and get 50 clicks. Your CPC is $2.
Imagine two restaurants. Restaurant A gets 500 people through the door. Restaurant B gets 100 people through the door. Restaurant A sounds like the winner. Until you find out only three people ordered food. Restaurant B had 100 people come in and 40 ordered.
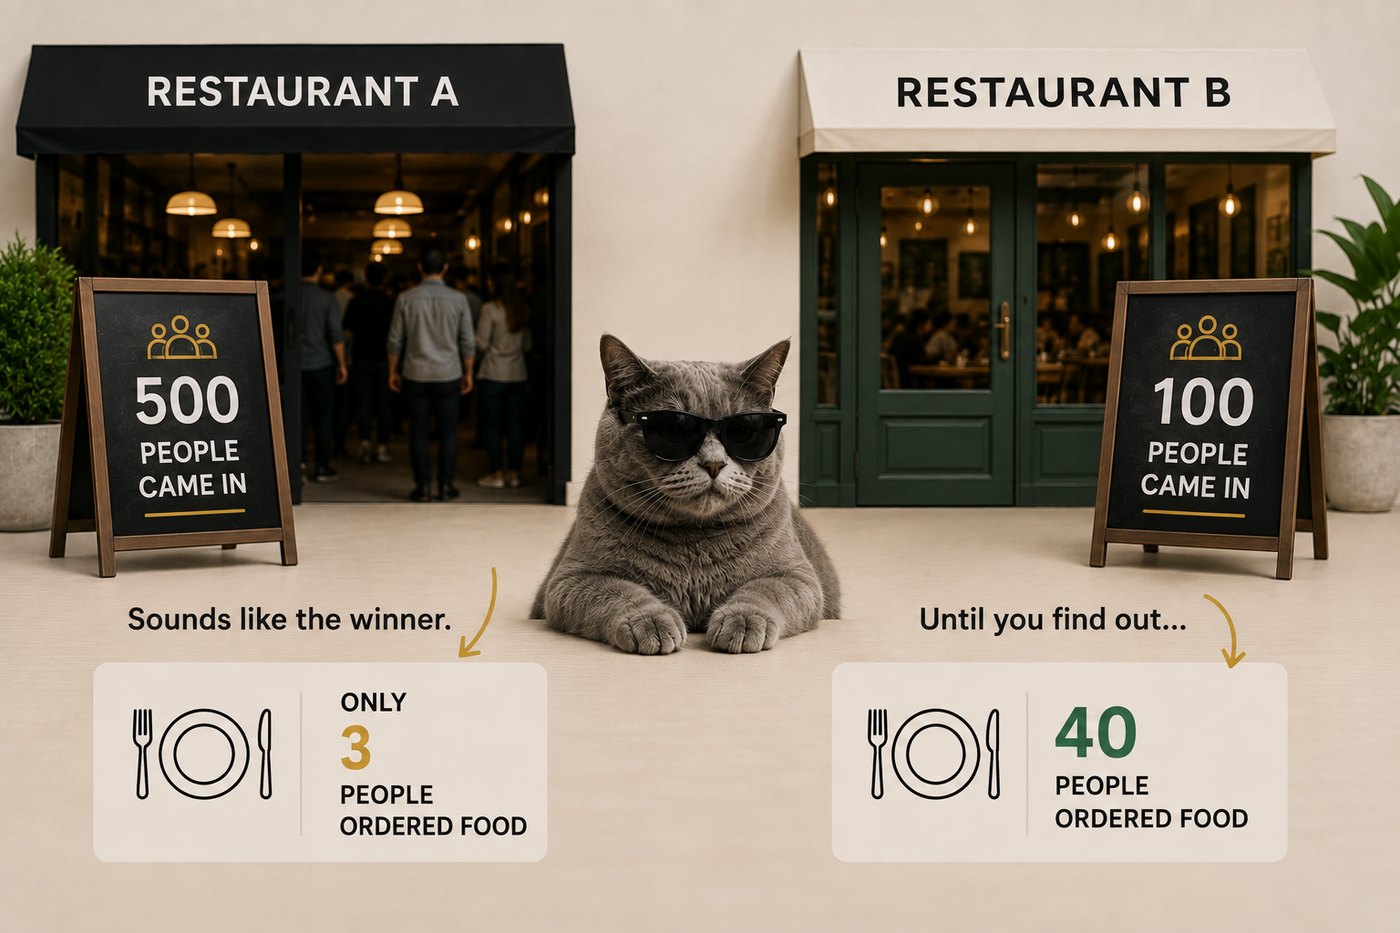
Cheap traffic isn’t necessarily good traffic. CPC tells me what I’m paying for the click. It doesn’t tell me whether the person who clicked was actually valuable.
CPC = the price of the click.
The strategist question“Are we getting cheap clicks or the right clicks?”
Average Watch Time
The average number of seconds people spent watching your video.
calculatedTotal watch time ÷ Video plays
Imagine you make a 30-second ad. People watch an average of 5 seconds. That’s very different from people watching 24 seconds.
Think about reading an article. Did you read the headline and leave? Did you get halfway through? Or did you actually finish it?
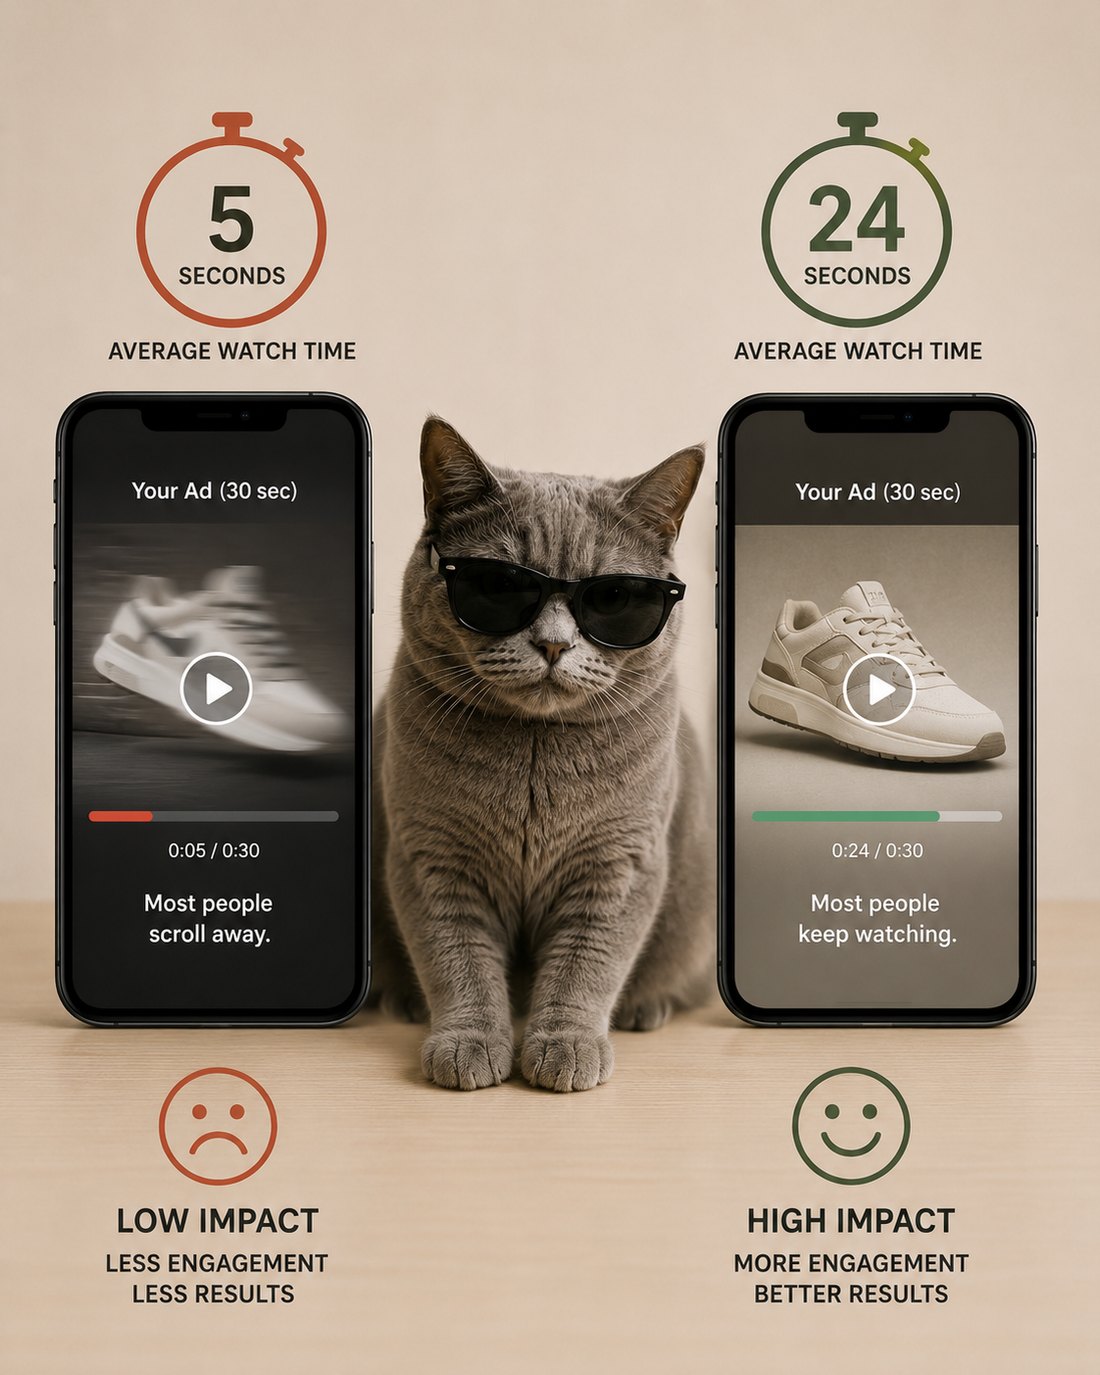
That’s what Average Watch Time helps me understand. It’s especially useful when I want to know how deeply the creative earned someone’s attention.
Average Watch Time = how long they stayed with the story.
The strategist question“How much of this did they actually consume?”
Video Completion Rate
The percentage of viewers who watched your entire video.
calculatedCompleted views ÷ Video plays × 100
If 1,000 people start watching your video and 100 finish it, your Completion Rate is 10%.
Think about watching a movie. Starting it doesn’t mean you finished it. Completion Rate tells you how many people actually stayed until the end.
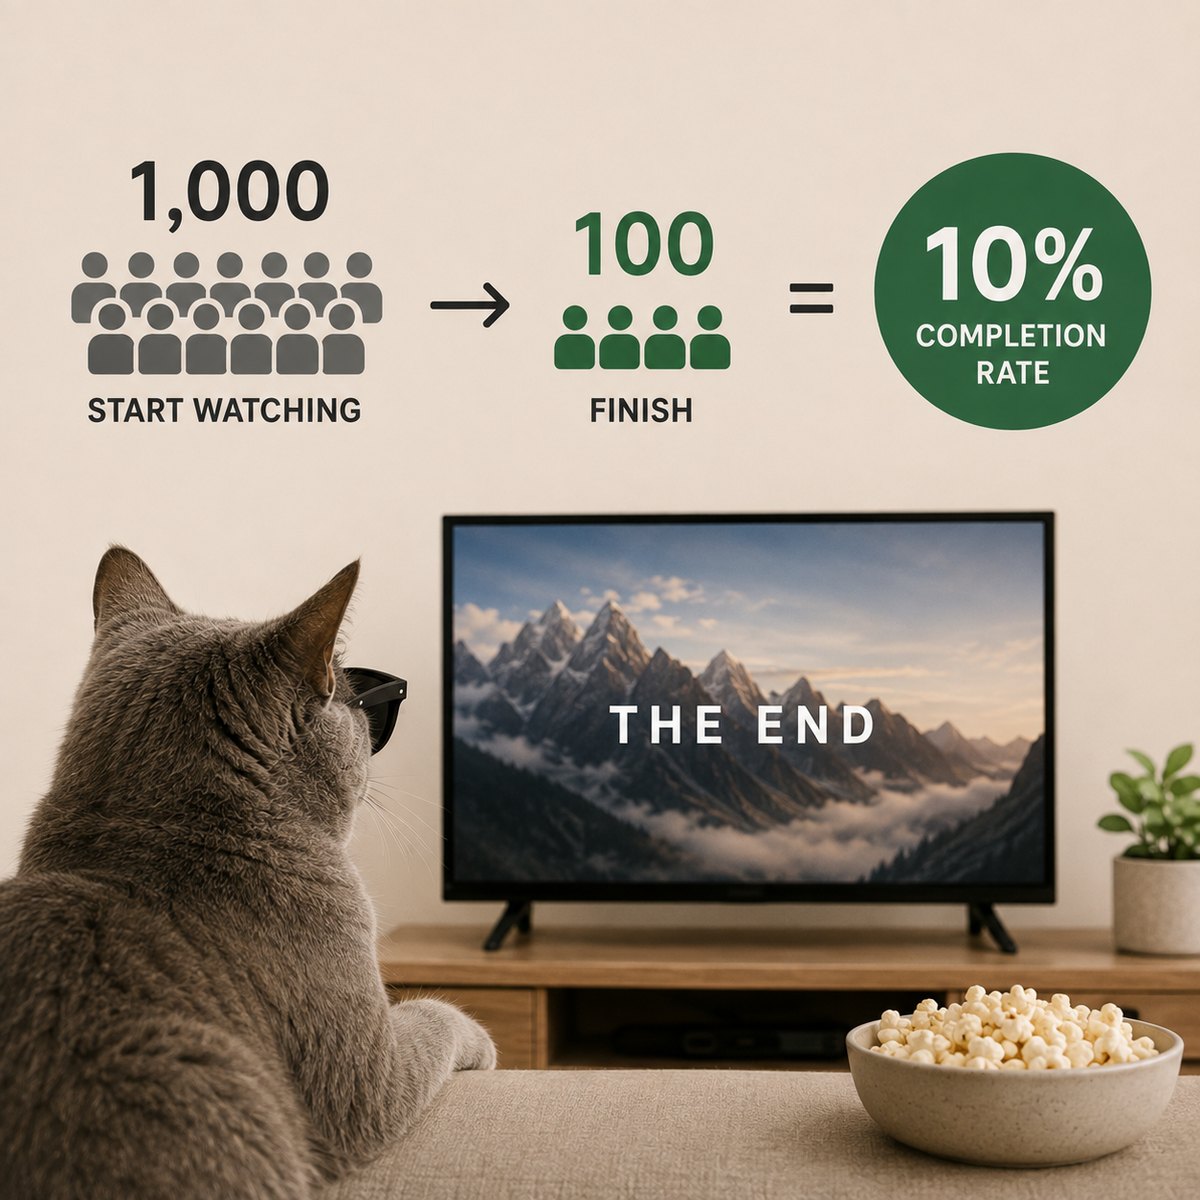
That’s what this metric is looking at. A high completion rate can tell me the creative held attention all the way through. But it doesn’t automatically mean the ad was successful. Someone can watch the entire thing and still never buy.
Completion Rate = did they stay until the end?
The strategist question“Did we earn enough attention to make them want the ending?”
ThruPlay Rate
The percentage of impressions that resulted in a ThruPlay.
calculatedThruPlays ÷ Impressions × 100
This is a calculated rate, not a standard Meta-reported metric.
A ThruPlay is a video view that lasts at least 15 seconds, or the entire video if it’s shorter than 15 seconds.
ThruPlay is a Meta metric that tells you whether someone watched enough of your video for the message to have a chance to sink in. You don’t need to memorize Meta’s exact definition. As a strategist, the question that matters is: Did they watch enough of the video to actually get the message?
Imagine showing someone a 20-second product demo. They watch for half a second and disappear. Another person watches enough to actually see the product being used. Those are very different viewers.
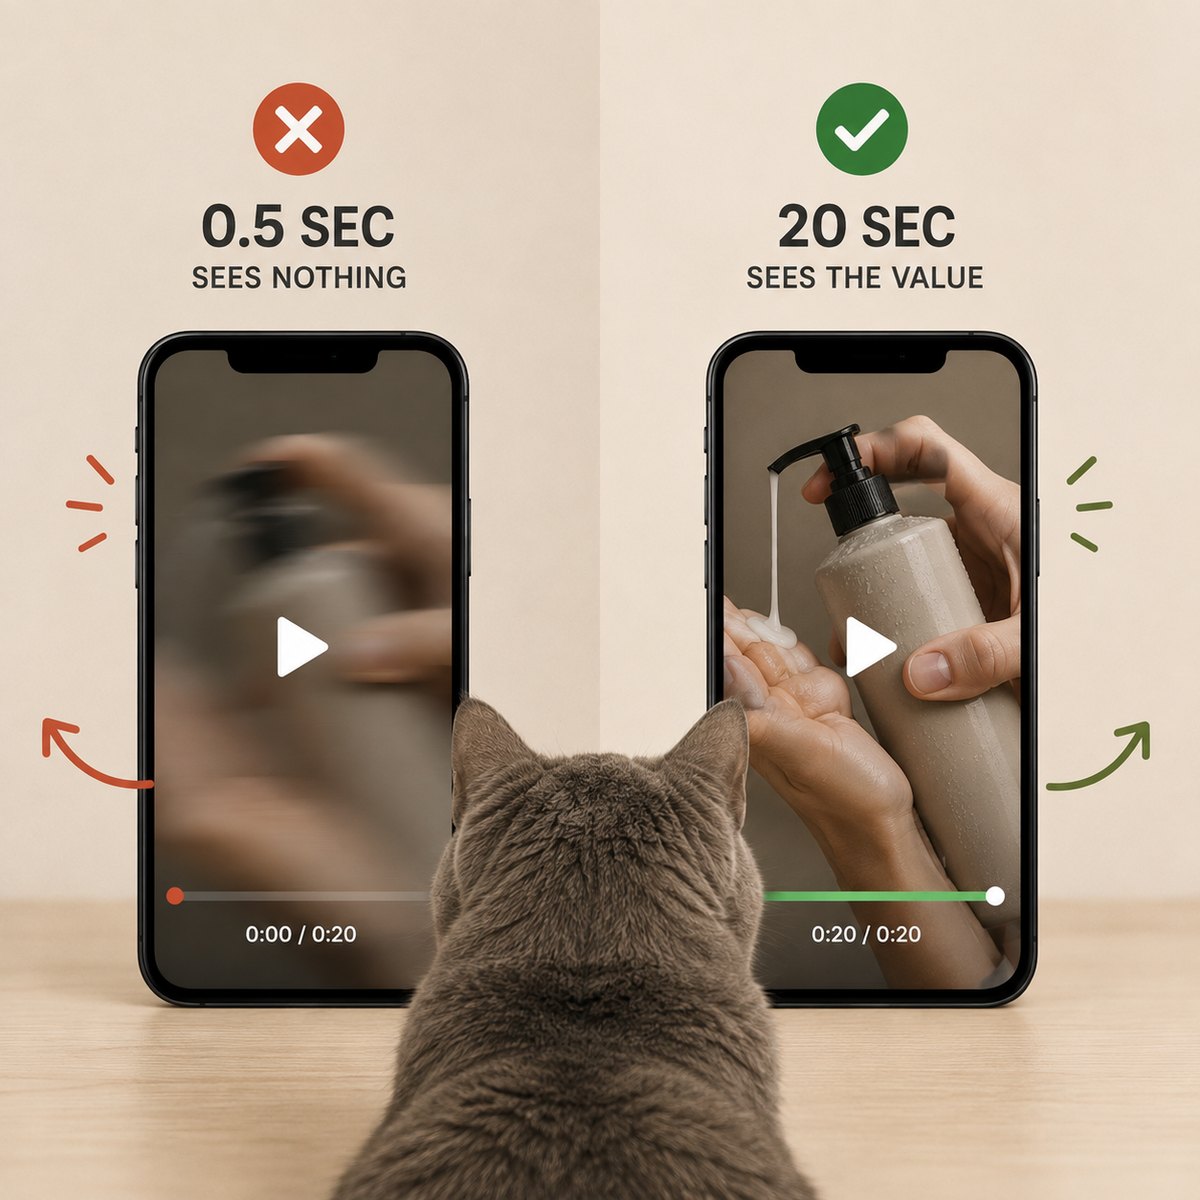
ThruPlay gives you a better idea of whether people watched enough of your video to actually consume the message.
ThruPlay = did they watch enough to actually get the message?
The strategist question“Did they consume enough of this for the idea to land?”
Scale is not performance.Reach · Impressions · Frequency · CPM
Frequency
The average number of times each person saw your ad.
calculatedImpressions ÷ Reach
Frequency is the average number of times each person saw your ad. If you have 100,000 impressions and reached 40,000 people, your frequency is 2.5.
Think about going to your local coffee shop. You see the same person once. You notice them. You see them again. You recognize them. You see them for the tenth time. Now you’re wondering if they live there.
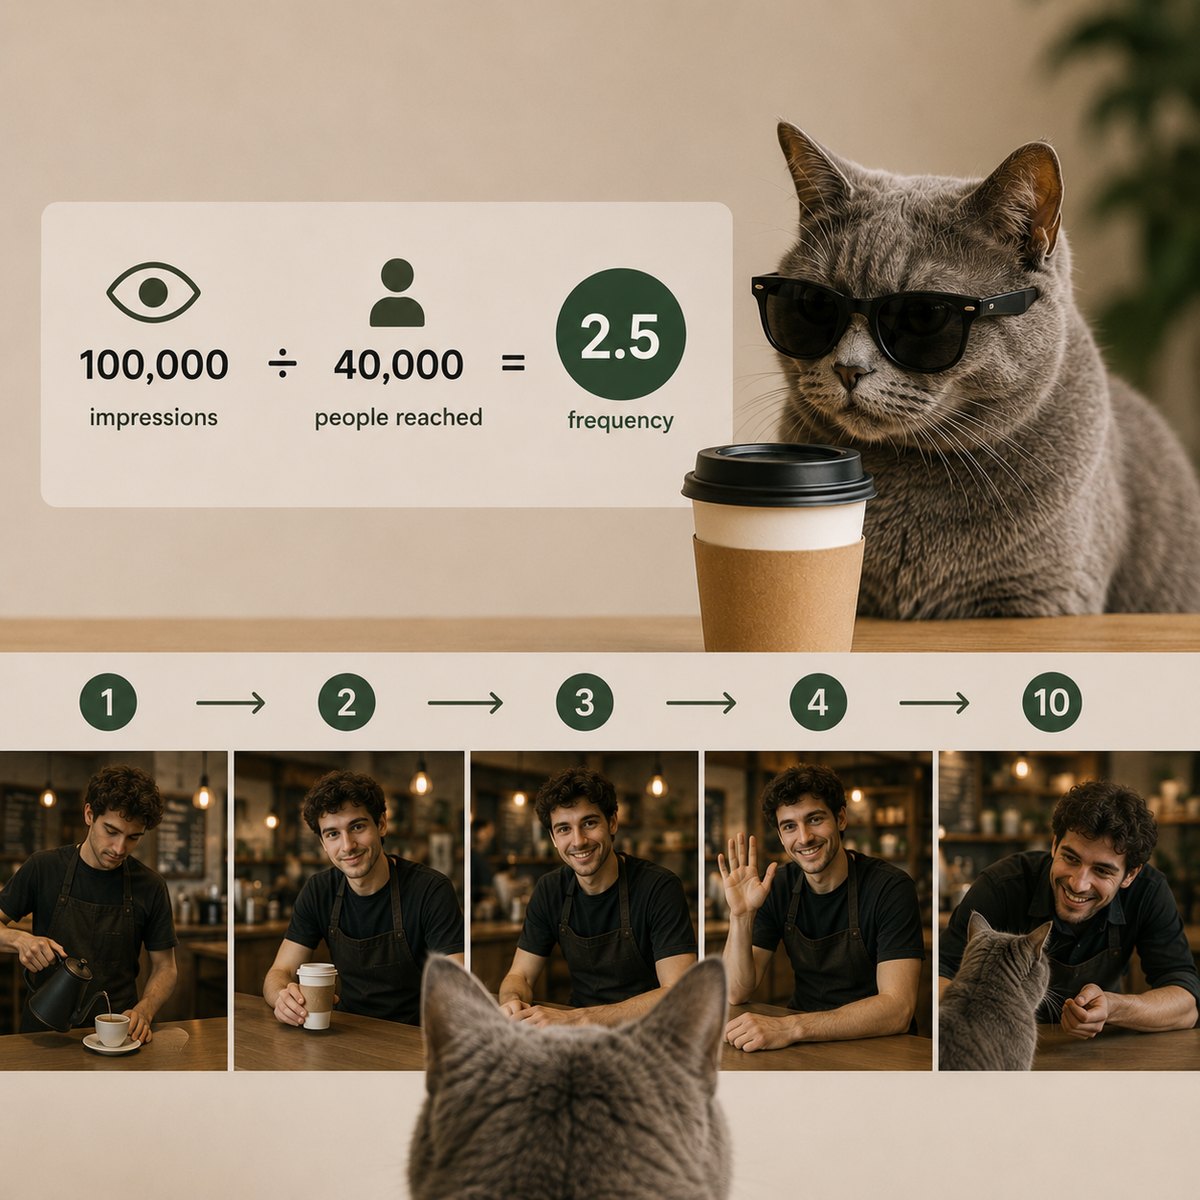
That’s frequency. High frequency isn’t automatically bad. Repetition can build familiarity. But if frequency keeps climbing while people stop clicking or engaging, you may have shown them the same story too many times.
Frequency = how often the same person sees you.
The strategist question“Are we building familiarity or annoying people?”
CPM
Cost Per Mille
How much you pay to show your ad 1,000 times.
calculated(Ad spend ÷ Impressions) × 1,000
CPM tells you what you’re paying to generate 1,000 impressions. A $20 CPM means you’re paying approximately $20 to show the ad 1,000 times.
Think about renting a billboard. You’re paying for access to the audience. You’re not paying for what they do after they see it.
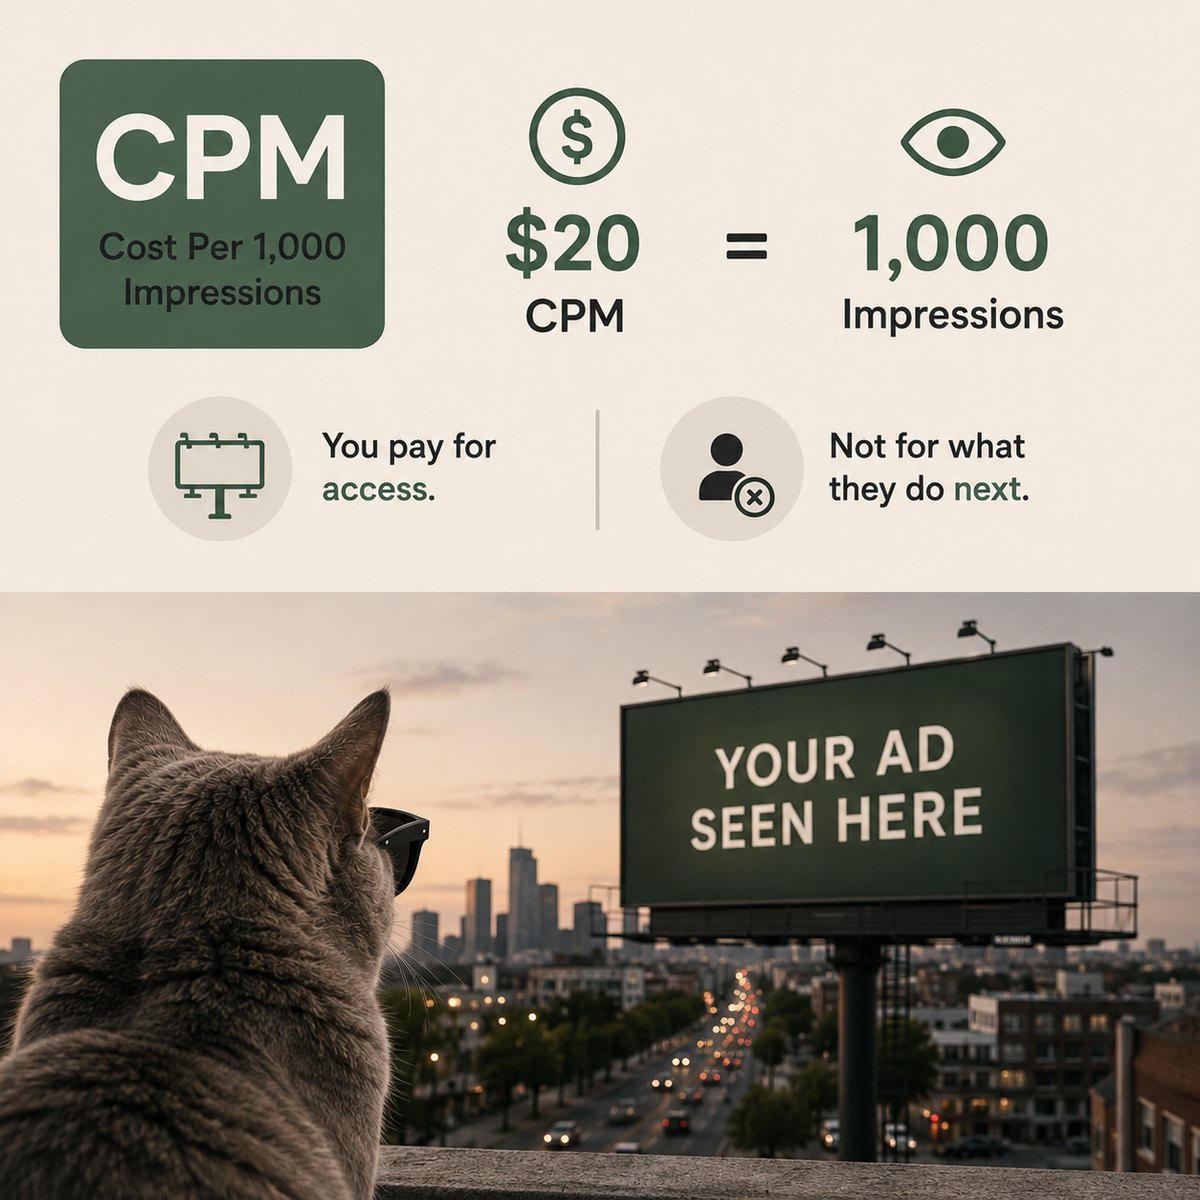
That’s important. A high CPM doesn’t automatically mean your creative is bad. The audience might simply be expensive because of competition, seasonality, geography or other factors. CPM tells me what the audience costs. It doesn’t tell me whether the creative is good.
CPM = the cost of getting 1,000 eyeballs.
The strategist question“Is this audience expensive, and are we getting enough value from reaching it?”
Reach
The number of unique people who saw your ad at least once.
calculatedCount of unique people served the ad
Reach is the number of unique people who saw your ad. Say your ad gets 100,000 impressions but reaches 40,000 people. That means 40,000 individual people saw it.
Think about handing out flyers. You hand out 100 flyers to 100 people. Then you hand another 100 flyers to the same 100 people. You distributed 200 flyers. But you only reached 100 people.
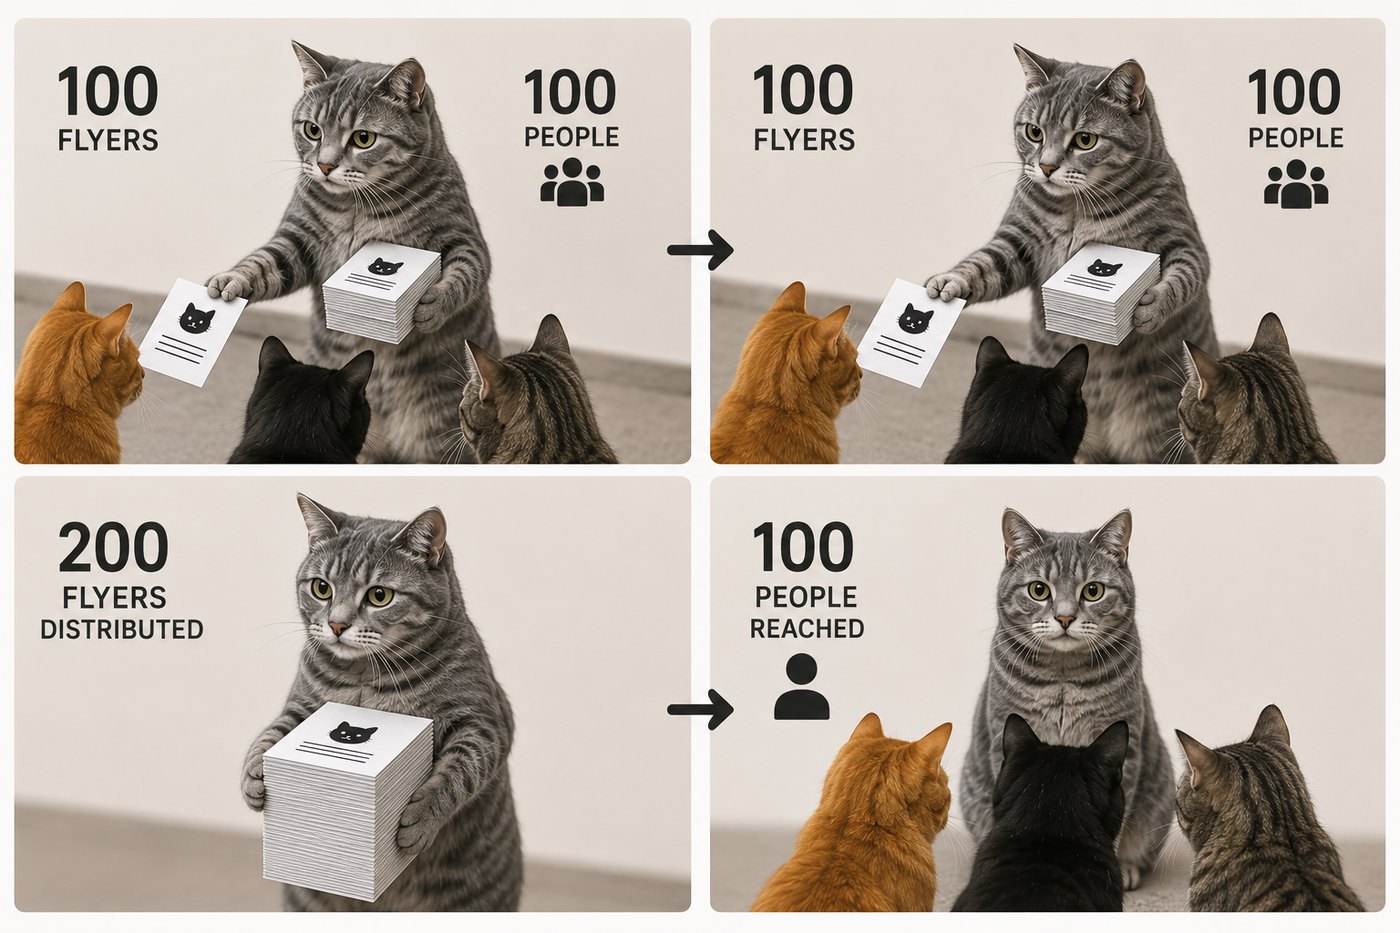
That’s the difference between impressions and reach. Impressions = how many total times your ad was seen. Reach = how many different people saw your ad.
Reach = how many different people saw you.
The strategist question“How many actual people did we get in front of?”
Impressions
How many times your ad was served, counting repeats by the same person.
calculatedCount of times the ad was shown
If your ad has 100,000 impressions, it was shown 100,000 times. That’s it. And here’s the important part: 100,000 impressions does not mean 100,000 people. One person could see your ad five times and create five impressions.
Think about flyers again. You put 100,000 flyers into the world. That doesn’t mean 100,000 people read them. It just means the flyers were distributed.

That’s why impressions tell me about exposure, not whether anyone cared. You can have a million impressions and a terrible ad.
Impressions = how many times you were shown.
The strategist question“We got the eyeballs. What happened after they saw us?”
Engagement Rate
The share of people who liked, commented, shared or saved the content.
calculatedEngagements ÷ Impressions × 100
Say 1,000 people see your ad. 50 of them do something with it, like comment, share, save, or like it. That gives you a 5% Engagement Rate.
Imagine two billboards. People drive past the first one. Nobody reacts. The second one makes people slow down, point at it and start talking about it.

That’s engagement. And the interesting part isn’t always the number. It’s what people are doing.
Sometimes an ad’s comments tell me more about the audience than the dashboard does. The dashboard can tell you what people did. The comments can tell you why. People might tell you what they disagree with, what they misunderstood, what they’ve already tried, what they’re worried about, or what they wish the product did. That can uncover objections, language, pain points, and new creative angles that don’t show up in your performance metrics.
For example, if an ad gets strong CTR but the comments are full of “Does this actually work?” you’ve learned something important. People are interested enough to click, but they still need more proof. That’s a creative insight you might never get from CTR alone.
Engagement = did this make someone react?
The strategist question“What did this creative make people feel strongly enough to do?”
MER
Marketing Efficiency Ratio
Revenue from the entire marketing operation against everything it spent.
calculatedTotal revenue ÷ Total marketing spend
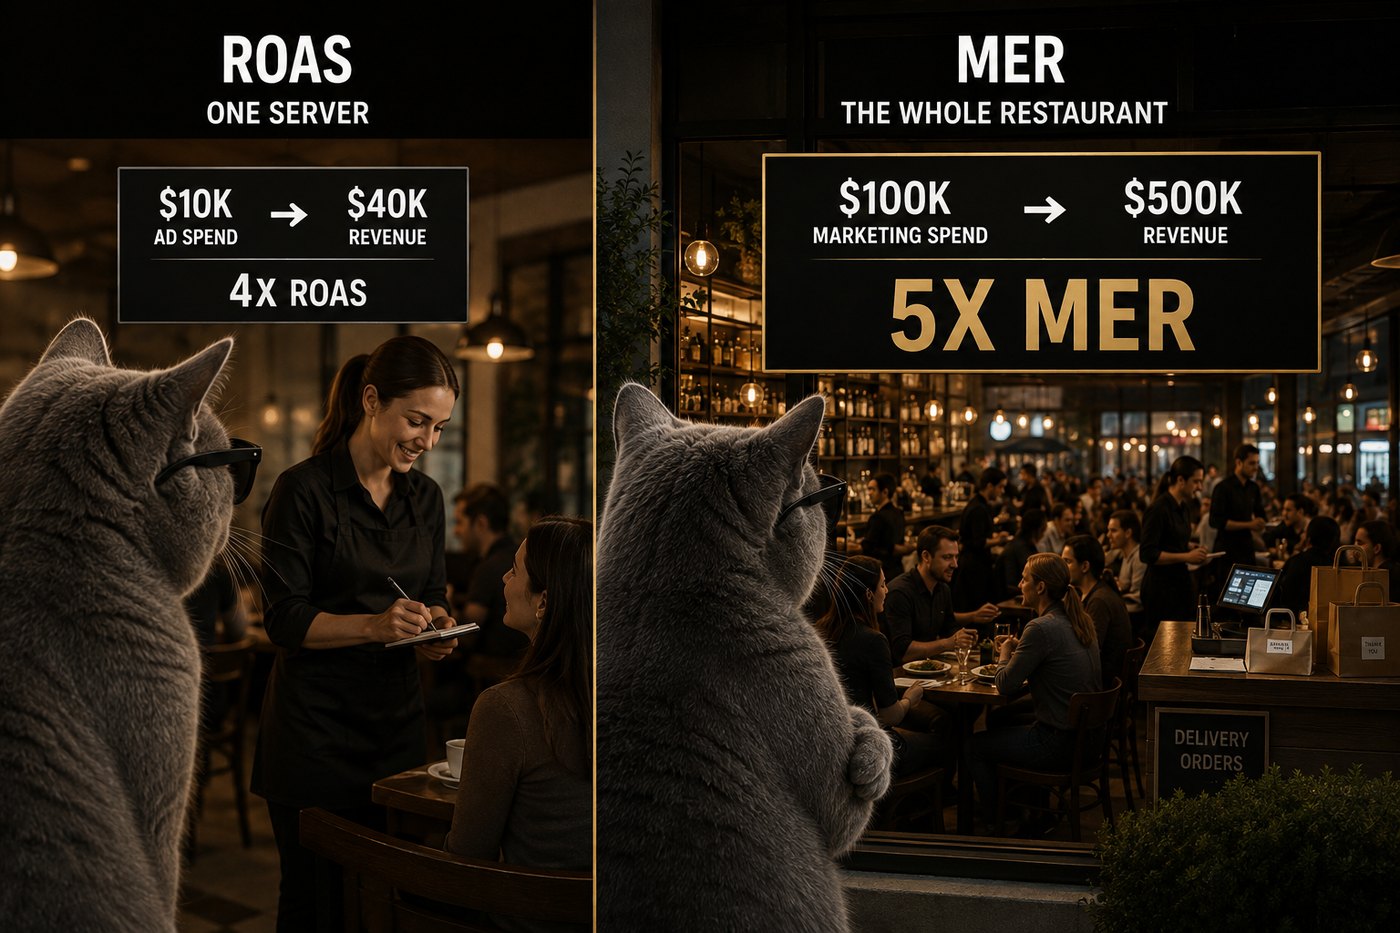
MER looks at total revenue compared with total marketing spend. Say the business generates $500,000 in revenue and spends $100,000 across marketing. That’s a 5x MER.
Think about a restaurant. ROAS might tell you how one server performed. MER asks how the whole restaurant is doing.
- The kitchen
- The servers
- The bar
- The marketing
Everything works together. That’s why MER is useful. It keeps you from focusing too much on one platform. You could have great Meta ROAS while the business is still struggling overall. ROAS tells you how one channel is performing. MER tells you how your marketing is performing as a whole.
MER = revenue generated by the entire marketing machine.
The strategist question“Is the whole system working, not just one channel?”
Every KPI is a clue. The number tells you what happened.
So which KPIs should a creative strategist actually care about?
You don't need to stare at every metric every morning. The most useful way to organize them is by the question they're answering.
And this is where KPI literacy becomes an actual strategic skill.
Reading the signal
Start at the top. Stop at the first thing that’s broken.
- Hook Rate is weakFix the opening.They never made it past the first three seconds.
- Hold Rate is weakFix the body of the ad.They stopped, but the rest of the ad lost them.
- CTR is weakLook at the message, offer or CTA.They watched. They just weren’t interested enough to act.
- Conversion Rate is weakLook at the landing page, offer or pricing.The ad did its job. Something after the click didn’t.
- CAC is highLook at acquisition economics.Everything worked. The business still can’t afford the customer.
That is why KPIs matter. Not because you're supposed to know what every acronym stands for, but because every number gives you a different window into what the customer is doing.
The best creative strategists don't look at a dashboard and ask, “Is this number good?” They ask, “What is this number telling me about the person on the other side of the screen?”
That's the difference between reporting performance and actually understanding it.
Want this applied to your account?
We build creative systems that make the deciding part repeatable.